

By Professor Chris Hatton, Manchester Metropolitan University
It is 10 years since an undercover Panorama programme reported on the horrendous abuse of people with learning disabilities and autistic people by staff members at an independent sector ‘specialist’ inpatient unit, Winterbourne View. The programme triggered a series of investigations, government reports and policies, and attempts to tweak the system with the aim of drastically reducing the number of people in inpatient services (continuing a history that started much earlier than the Panorama programme).
What can publicly available statistics tell us about what’s happening to these inpatient services and the people within them, and what don’t they tell us that we need to know?
How many people are in inpatient services?
Monthly snapshots of how many people are in inpatient units are available from two sources, published by NHS Digital.
The first is the assuring transformation (AT) dataset – collected retrospectively by health service commissioners in England on ‘specialist’ inpatient services for autistic people and people with learning disabilities. The second uses the mental health services data set (MHSDS) to record information from service providers flagging people with learning disabilities and autistic people in any mental health inpatient service.
There are some big differences between these datasets. The MHSDS includes people in mainstream mental health inpatient services, often for short durations, which the AT dataset tends to ignore. The AT dataset reports more detailed information on service processes (reviews, transfer plans etc), while only the MHSDS reports information on restrictive interventions (restraint, seclusion and segregation).
The chart shows the number of people in inpatient services over time, according to the AT and MHSDS datasets. I have also added in data from a 2013-2015 annual census of people with learning disabilities in inpatient services for a slighter longer timeline.
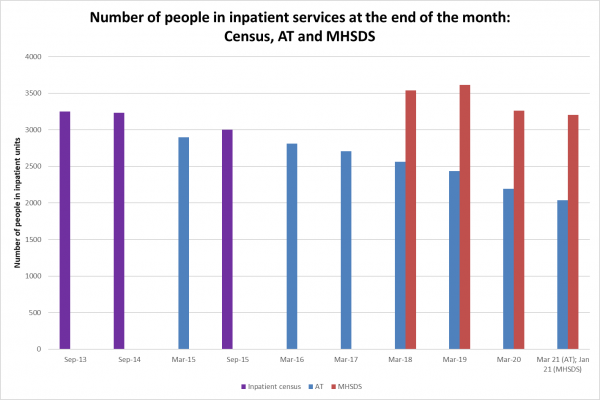 According to the AT dataset (blue columns), the number of people in inpatient units has been gradually reducing over time, although not nearly quickly enough to meet successively redrawn government targets. The MHSDS dataset (red columns) also show a reduction over time, although the number of people reported is much higher than in AT (typically an extra 1,000 people).
Even these gradual reductions might overstate ‘progress’. First, AT numbers are retrospectively reported by commissioners, with around 100 people typically being added after the figures are first reported. So, when looking at the latest month’s AT numbers, add 100. Second, we are still living through Covid-19. During the first lockdown, the number of people going into inpatient services dropped sharply and there are still ongoing restrictions – is this drop permanent or will the number of people in inpatient services creep back up?
Third, these figures are snapshots of how many people are in inpatient services at the end of each calendar month, and they miss out people who are in generic mental health inpatient services for very short periods of time. The MHSDS reported 3,205 people in inpatient services at the end of January 2021, but 4,215 people in inpatient services at some point during the month, including 325 people for the purposes of ‘respite’. Surely government policy should be equally concerned with people in generic mental health inpatient services, alongside people in ‘specialist’ inpatient units?
How many people are leaving and entering hospitals?
The government has emphasised the number of people ‘discharged’ from inpatient units. Information from AT, which I’ve put together from the monthly statistics, shows that in the five years from October 2015 to September 2020 there have been 10,830 ‘discharges’, with numbers increasing from 2015-16 to 2017-18 but decreasing since.
Why am I putting ‘discharges’ in quotation marks? First, because over a fifth of ‘discharges’ (21%) were actually transfers to other inpatient hospitals, with another 14% being ‘discharges’ to mysterious ‘other’ locations. This leaves just under two-thirds of ‘discharges’ (65%) actually being people moving out of an inpatient unit to their family home, supported housing or residential care.
Second, because in both datasets, the deaths of people in inpatient services are recorded as a type of ‘other discharge’. How many people have died in inpatient units? We don’t know. Because of standard NHS Digital rounding rules, all the data in the AT and MHSDS datasets are rounded to the nearest five, or suppressed if the number is less than five. With the exception of April 2020 (the first peak of the Covid-19 pandemic), where AT recorded 5 deaths and MHSDS 10 deaths, no individual month in either dataset has recorded any figures on the number of people who have died. If any month with suppressed data can represent 0-4 deaths, then over the course of a year this could be anything from 0-48 people’s deaths not represented publicly.
What about the number of people going into inpatient services? Using AT information, from October 2015 to September 2020 there were a total of 9,740 admissions to specialist inpatient units. The number of admissions had been increasing year-on-year, until a drop in 2019-20 related to Covid-19. A quarter of these admissions (25%) were actually transfers direct from another hospital or inpatient unit, and 16% of admissions were re-admissions of people who had previously been in an inpatient unit less than a year before.
Given this pattern of admissions and discharges, it’s no surprise that the average length of stay for people has hardly changed. The average length of stay for people in their current inpatient unit was 2 years 8 months in September 2020, and the average continuous length of stay (including transfers between inpatient units) was 5 years 8 months in September 2020.
Plans for getting people out of inpatient services
The AT dataset has a lot of information on care plans, reviews and transfer plans – what does it tell us?
According to people’s care plans, in September 2020 over a quarter of people (27%) in inpatient units did not need inpatient care, with 5% of people in inpatient units experiencing a delayed transfer of care. Just under half (49%) of all people in inpatient units had a transfer planned at some point in the future, and for 9% of all people in inpatient units their planned transfer was overdue.
Less than half of transfer plans were agreed with important people and organisations, like the person themselves (41%), the person’s family/carer (36%), the local community support team (44%) or commissioners (47%).
Lessons for social workers, 10 years on from Winterbourne
How can social workers uphold the human rights of people with learning disabilities and autistic people, 10 years on from Winterbourne? Social work managers Claire Webster and Jack Skinner share their tips.
Restrictive interventions
Statistics on restrictive interventions used on people in inpatient units are published monthly in the MHSDS dataset. There are big monthly fluctuations in the number of restrictive interventions reported in the MHSDS, mainly because information on restrictive interventions is not reported for almost all independent sector services almost all of the time.
What information there is suggests that restrictive interventions may have increased since the start of the pandemic. By January 2021, 420 people during the month (13% of all people in inpatient units) were subject to at least one restrictive intervention and a total of 3,970 restrictive interventions were reported (an average 9.5 per person, almost one every three days).
A wide range of restrictive interventions are reported (and these numbers don’t include most independent sector inpatient services), including:
- Chemical restraints, most commonly oral medications (used 405 times on 80 people) and rapid tranquilising injections (used 280 times on 65 people)
- Mechanical restraints (used 40 times on 20 people)
- Seclusion (used 340 times on 165 people)
- Segregation (used 15 times on 10 people)
- Eight different types of physical restraint, most commonly
- Supine restraint (used 620 times on 145 people)
- Seated restraint (used 540 times on 120 people)
- Standing restraint (used 480 times on 160 people)
- Restrictive escort (used 335 times on 85 people)
- Prone restraint (used 255 times on 85 people)
- ‘Other’ types of physical restraint (used 615 times on 120 people)
What do we need to know?
The statistics that are made public give us quite a detailed picture of policies that are falling far short of their ambitions. But there is so much these statistics don’t tell us that we really need to know:
- Information used for policy purposes needs to systematically include the experiences of people who are in inpatient services and those close to them, rather than being pushed to the margins of ‘stories’.
- The scale and detail of information on people in inpatient services is not matched by information on the types of community support recommended in Building the right support. It seems strange not to have any information on the services and supports that are supposed to be largely replacing inpatient services.
- We need complete information from all inpatient services, and we need information aggregated over time so we can learn important information like the number of people who have died in inpatient units.
- As well as the snapshots, we also need information that tracks people over time to understand issues like the extent of ‘revolving door’ usage of inpatient services.
- We need to better understand the very diverse groups of autistic people and people with learning disabilities who potentially come into contact with inpatient services, rather than lumping everyone into ‘and/or’ groups.
Where will we be in another 10 years?
Chris Hatton is a professor in the department of social work and social care at Manchester Metropolitan University

 A trauma-informed approach to social work: practice tips
  Problem gambling: how to recognise the warning signs


 Find out how to develop your emotional resilience with our free downloadable guide
  Develop your social work career with Community Care’s Careers and Training Guide
  ‘Dear Sajid Javid: please end the inappropriate detention of autistic people and those with learning disabilities’
 Ofsted calls for power to scrutinise children’s home groups
 Seven in eight commissioners paying below ‘minimum rate for home care’

 Facebook
 X
X LinkedIn
 Instagram
This is very worrying and I feel it stems for either a lack of knowedge around learning Disabilities and certainly autism by the powers that place people in these hospitals or a reluctance to understand, bith aspects being very worrying.
It is also to the complete lack of facilities in the community for persons with learning disabilities and autism and also a complete lack of finance in all areas of social and health care.
Much of this is deliberate inaction by various UK Governments including both many past and the current.
No urgency is apparently being considered by this Government, as was also so with past Governments.
Now this Government appears to be ready to issue a directive on COVID Vaccines with regards to staff at Care Homes and again without no apparent understanding of the care profession.
If this directive goes ahead as it is currently understood then this will bring another area of crisis to the care profession and could well mean that the staff shortages could be increased.
This Government is showing a complete lack of duty of care to a profession and people in need of care for COVID vaccinations is one of many areas that need to be improved.
Such as
Working conditions
staff pay
staff sickness benefits
let alone the quality and quantity of care
I say forget about the making vaccinations compulsary, sort out the long stay provision of people admitted when other areas would be better to consider.
What it will mean is a considerable cash injectionand not a million here and a million there, but one that will put social care on an even footing. It will mean, at least reversing all the austerity cuts and much more.
We need to be careful about assuming that a move out of hospital is necessarily for the better and stop our concerns there. In some places hospitals are being converted into residential homes and run by organisations wanting to make profit, without providing better outcomes for the residents.
The sector is going the same way that we now complain about children’s residential homes.